Farm Learning
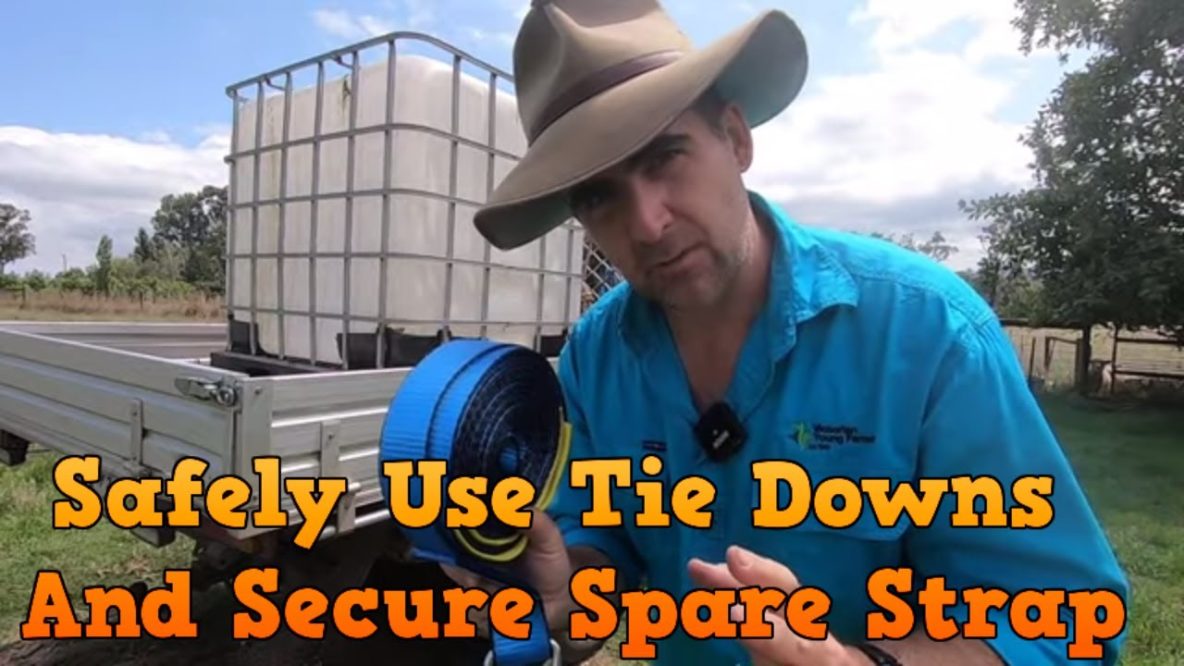
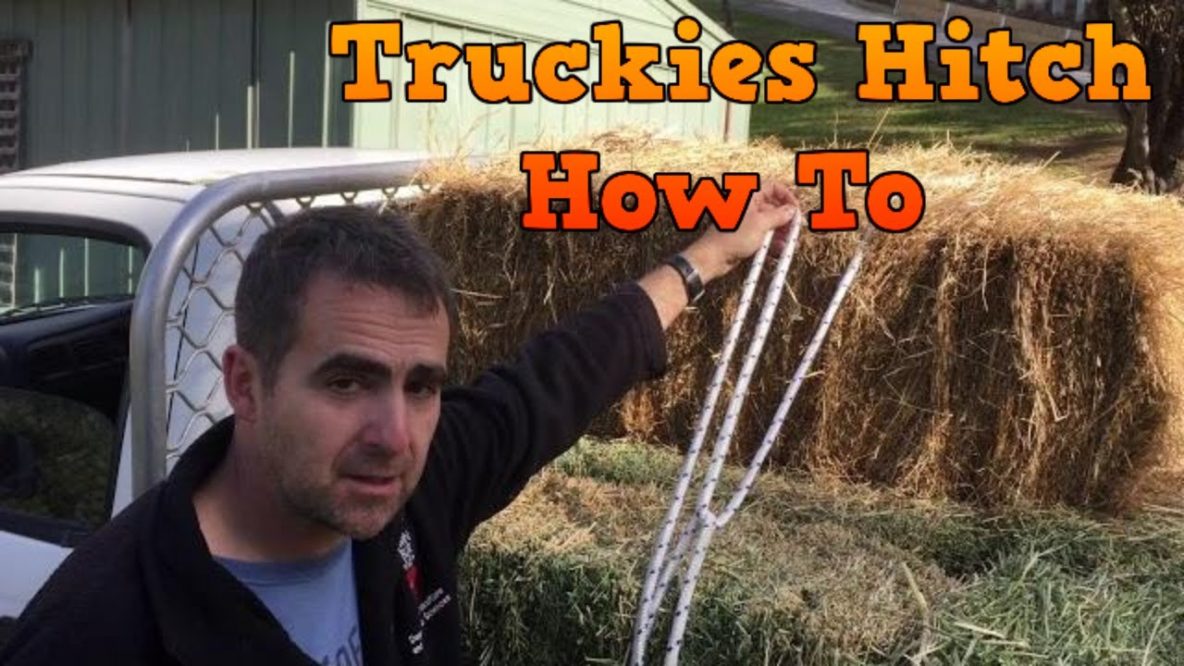
How to Secure Excess Rope on Loads Safely and Neatly.
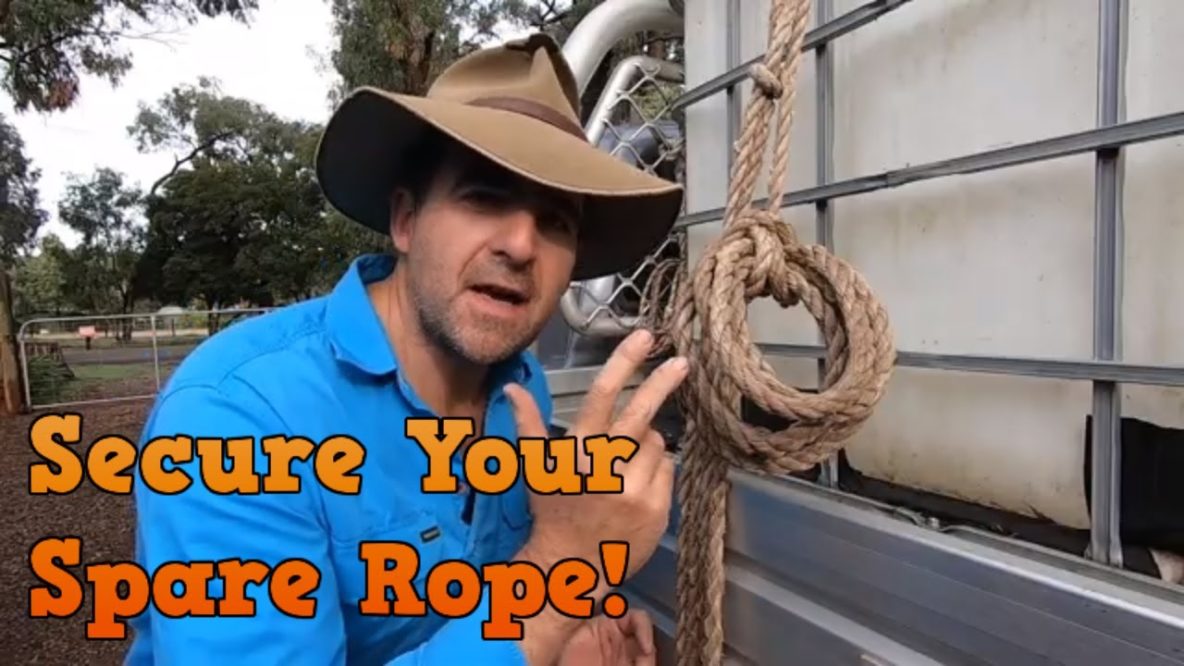
Ever struggled to secure spare rope when you have finished tying down a load? Or worse yet, had rope fall off your tray and drag along the road after you? This week I demonstrate a simple and easy way of securing spare rope to avoid accidents and fines. How to tie a truckies hitch video https://youtu.be/fvjoE-xAft Subscribe for a new … Read More